Train Derailments and Hazmat Spills: A Machine Learning (Mis)adventure
✨🚆 Choo choo! All aboard the algorithm train! Today, we’re taking a wild ride into the world of train derailments and hazardous material spills. As a machine learning & data enthusiast with a passion for making a difference, I embarked on this journey to understand and predict these incidents better. Buckle up, explorers, and let’s dive in to the Hazmat Predictor project. 🚂💨
Why Should We Care?
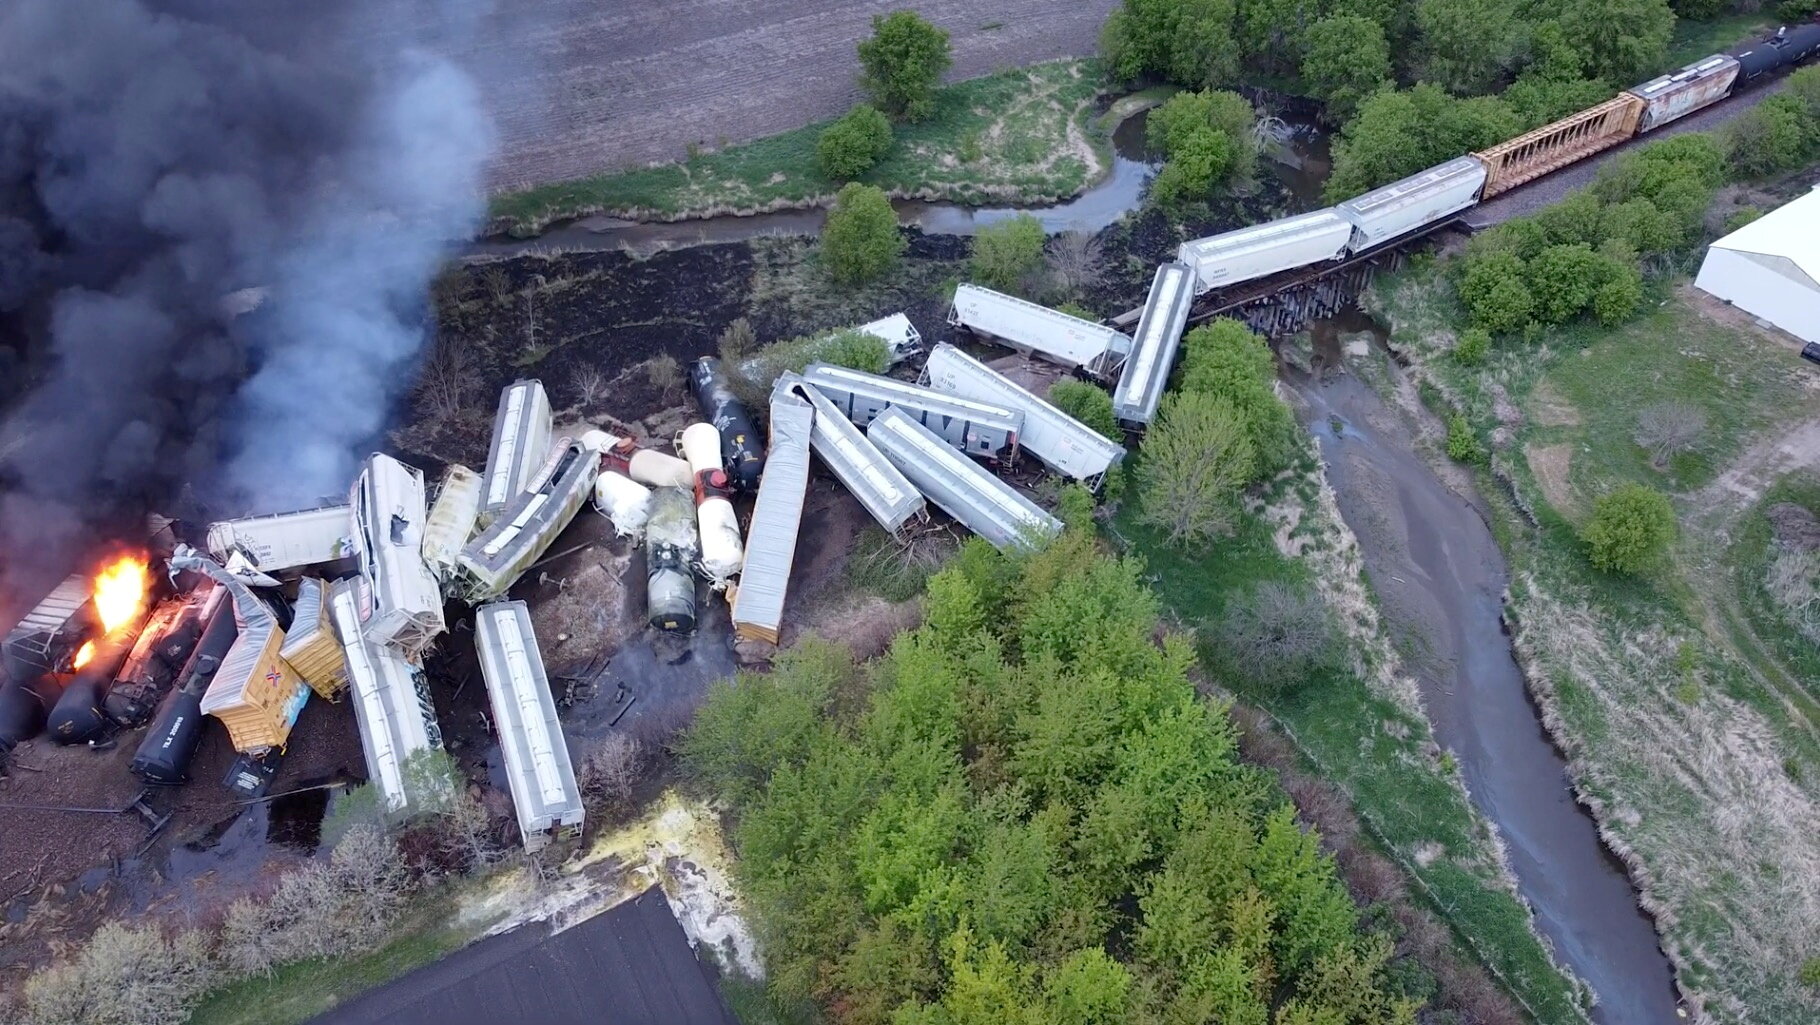
Train derailments and hazardous spills might seem irrelevant to you in the macro, but they’re so not. Here in the U.S., we average 3 trail derailments per day. In 2022 alone, there were at least 1,164 train derailments across the country,according to data from the Federal Railroad Administration. With recent events like the Department of Justice (DOJ) filing suit against Norfolk Southern over alleged violations of the Clean Water Act, it’s clear that this issue is a significant concern to our health and environment. 🌊🚨
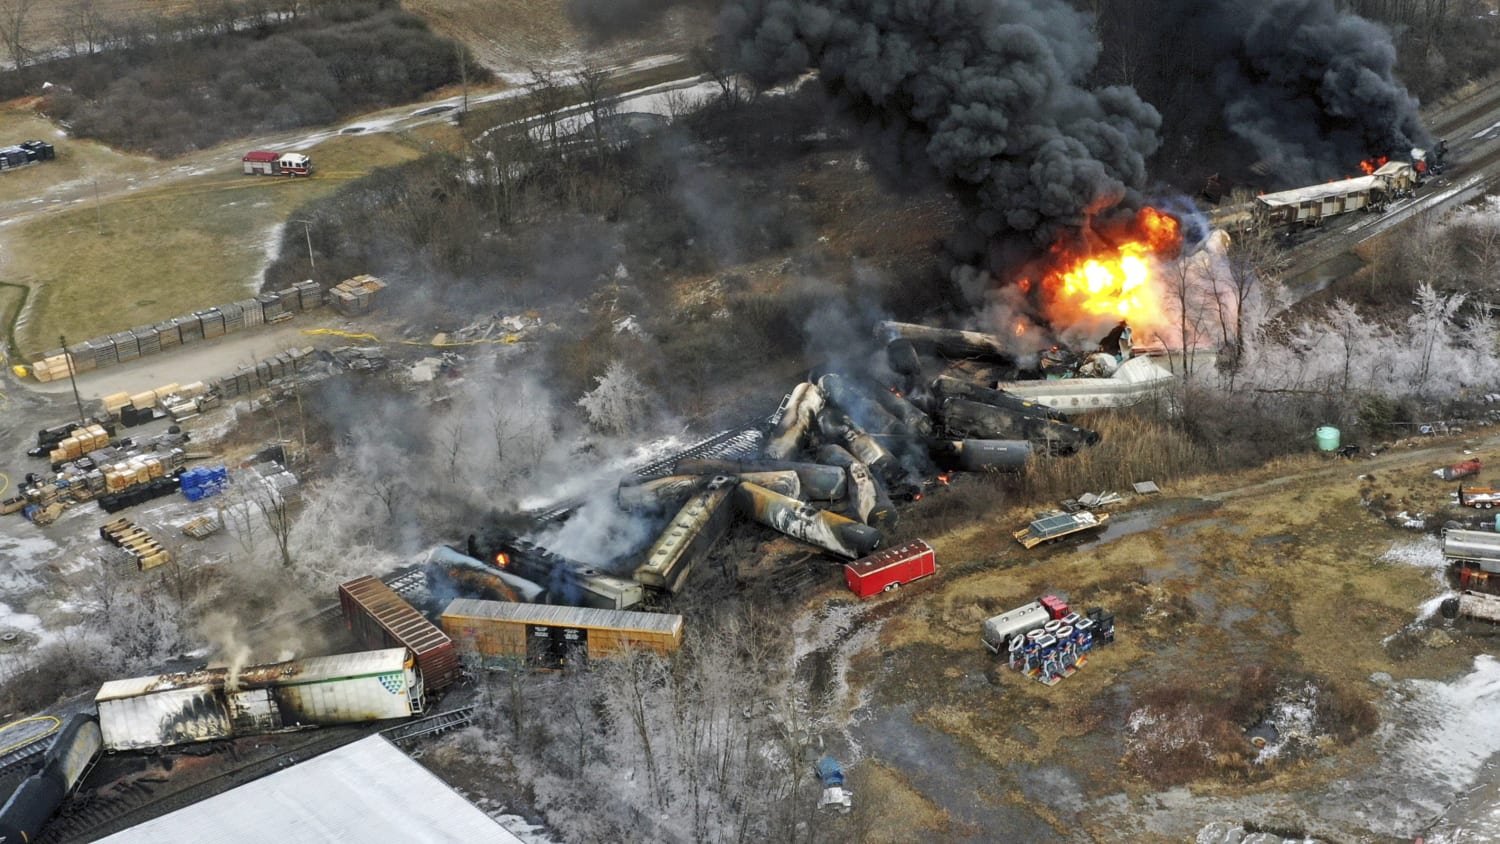
As someone who cares about the world we live in, I found it disheartening to see the lack of attention and coordinated response to these incidents. I won’t get political, but it’s high time we harness the power of machine learning and data science to address these problems. 🌍❤️
The Dataset: A Treasure Trove of Railroad History
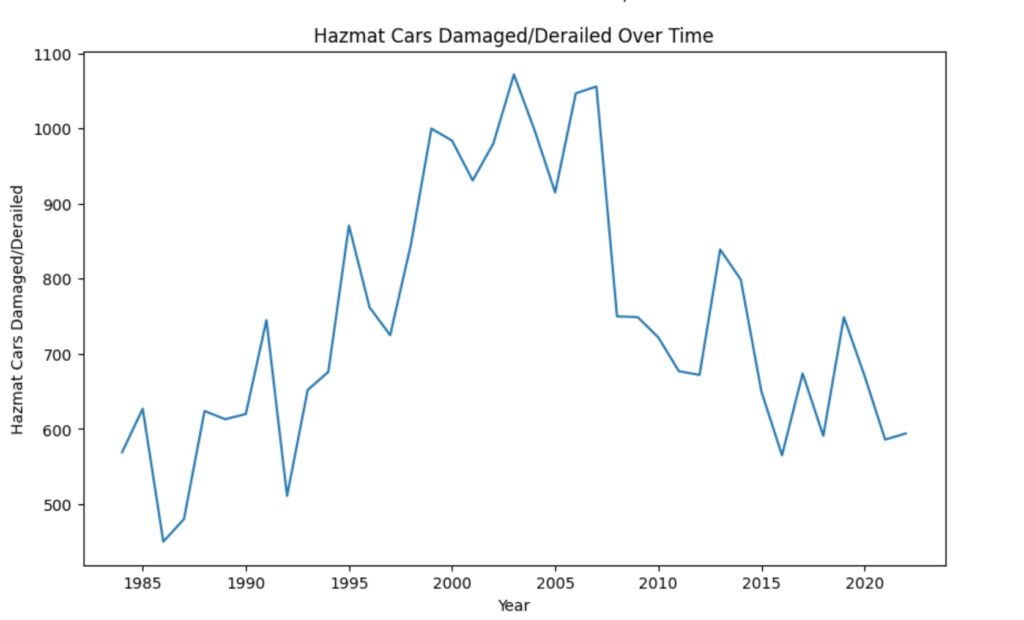
For this project, I dug into 39 years of historical railroad accident and incident data. The goal? Predict the number of Hazmat releases and Hazmat cars damaged/derailed incidents for any given year. Sounds like a good plan, right? Well, it wasn’t all smooth sailing. ⚓️🏴☠️
Choosing the Right Model: A Battle Royale 🥊
To predict these incidents, I needed to find the right model. I started by trying out three popular models: Linear Regression, Random Forest, and Gradient Boosting. But finding the best one was like trying to pick the best porridge – the options were all pretty good, but only one would be the perfect fit. 🍦🧐

Linear Regression: The OG of Data Science
First up was Linear Regression, the tried-and-true method for making predictions based on a linear relationship between input features and a target variable. It’s kind of like the comfort food of data science – you know what you’re getting, and it’s usually pretty satisfying. 🍲📈
Random Forest: A Walk in the Woods 🌲
Next, I explored the Random Forest model, which uses a collection of decision trees to make predictions. It’s like a stroll through an enchanted forest, with each tree contributing its wisdom to the final decision. 🧙♂️🌳
Gradient Boosting: Leveling Up 🎮
Finally, I tested the Gradient Boosting model, which also uses decision trees but with a twist: it iteratively improves the model by combining weaker learners to create a stronger one. It’s like leveling up in a video game, getting better and better with each round. 🚀👾
The Struggle Is Real 💔
Embarking on a solo project outside of class was a whole new ballgame. I faced my fair share of struggles, concerns, and arguments with ChatGPT (the AI language model helping me out) about why my models weren’t working. But I never lost sight of why I was doing THIS PROJECT. 🌟👀

Cross-Validation: The Holy Grail 🏆
To fine-tune these models, I turned to cross-validation, a technique that helps evaluate a model’s performance by dividing the dataset into multiple smaller subsets. It’s like the holy grail of model evaluation – when used wisely, it can help you find the model that slays the prediction game.🗡️🐉
Feature Engineering: The Art of the Remix 🎧
Another crucial step in this data science adventure was feature engineering – the process of creating new features or tweaking existing ones to improve the model’s performance. Think of it as remixing your favorite song to create a fresh new sound that gets everyone dancing. 🕺💃
I experimented with different combinations of features, such as the number of accidents per year, the average speed of trains, and the total number of Hazmat cars involved. Working on the Hazmat Predictor project was like a game of Tetris, trying to find the perfect fit for each piece. 🧩🎮
Results: A Glimpse into the Future 🔮
After all the struggles, late-night coding sessions, and gallons of coffee consumed, I finally had my models ready to make predictions. The winner of this epic battle royale was none other than… drumroll, please… Gradient Boosting! 🎉🥇
Armed with this powerful model, I was able to predict the number of Hazmat releases and Hazmat cars damaged/derailed incidents for any given year. It was like peeking into a crystal ball and catching a morbid glimpse of the dystopian future. 🔮✨
What’s Next? 🚀
This Hazmat Predictor project may have been a rollercoaster ride, but it was also an incredible learning experience, albeit gut-wrenching. I’m super curious to see what further discoveries lie ahead and how this project can contribute to a safer and cleaner world. Who knows, maybe I’ll track the EPA’s actual involvement vs. their claimed involvement. One can only hope… 🌐💚
But I can’t do it alone. I need your help! If you’re intrigued and have the time, please check out my Github repo. Feel free to share your insights, or join me on this quest for a better understanding of rail safety and environmental protection. 🤝🌟
🔗 Github Repository – Hazmat Predictor
Let’s start a conversation – share your thoughts in the comments. 📣🌍
So, fellow explorers, that’s a wrap on this (mis)adventure. But fear not, for there are countless more journeys to embark on and mysteries to unravel. Until next time, stay curious, keep learning, and let’s make the world a better place, one data point at a time! 🌈🦄